Apr
01
2026
Ideum recently completed the installation of a new interactive exhibit at the Mote Science Education Aquarium, Mote Marine Laboratory & Aquarium’s new public-facing science center in Bradenton, Florida. Designed to showcase the breadth of Mote’s ongoing research, the custom exhibit software, called Data Dashboard, brings real-time science and discovery to life through large-scale interactive touch displays.
Mote scientists generate vast amounts of data each year—from ocean health and coral restoration to marine animal research. The goal of the Data Dashboard exhibit was to make this information accessible, engaging, and meaningful for visitors of all ages.
To achieve this, Ideum developed a custom software experience built in Unity, paired with a Directus content management system. This allows Mote’s scientific team to continuously update and curate content, ensuring the exhibit evolves alongside their latest research.
The result is an experience that transforms complex datasets into interactive stories—inviting guests to explore, discover, and connect with the science happening behind the scenes.
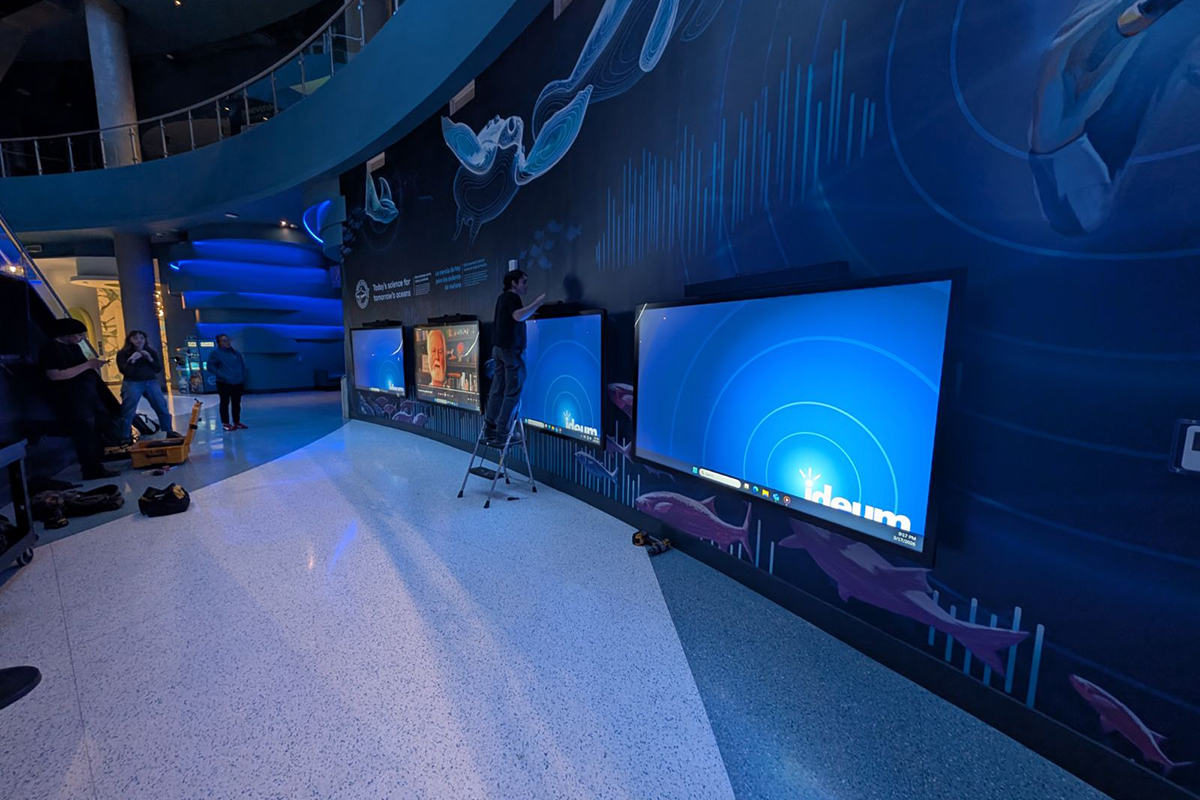
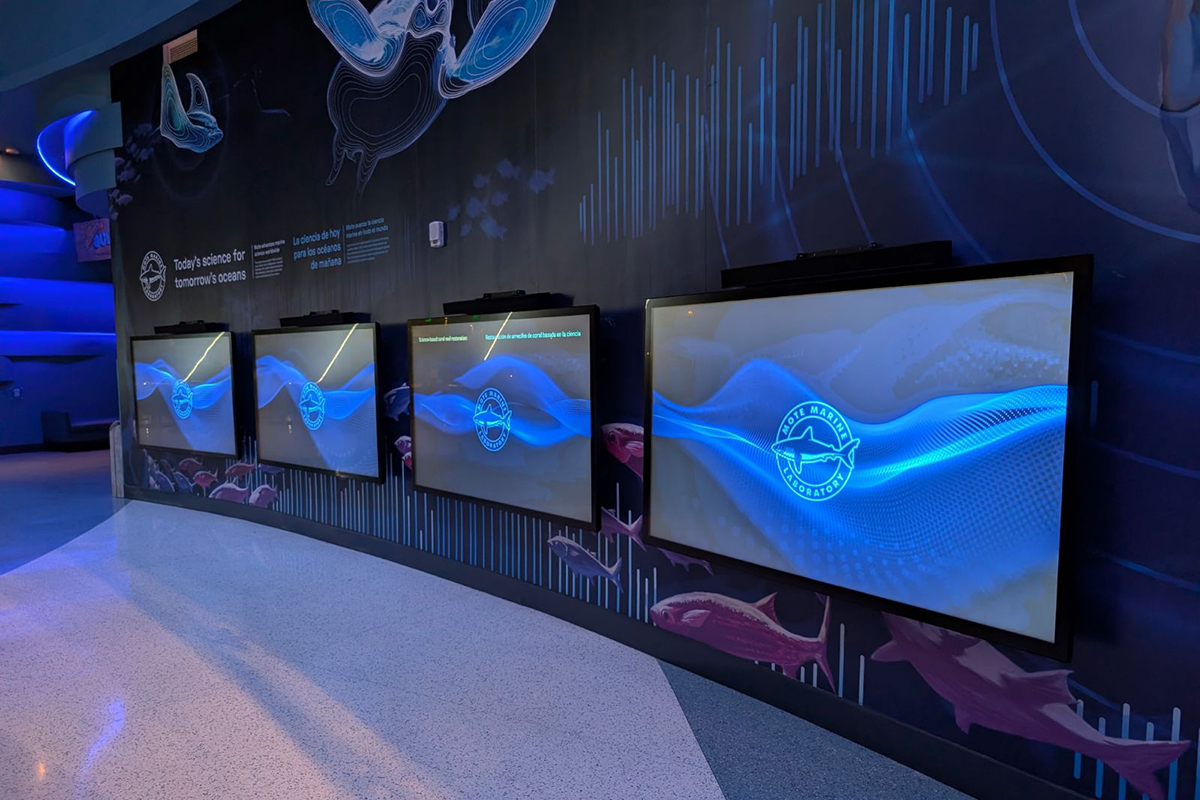
The exhibit features four 86” Ideum 4K Presenter touch displays, each mounted adjacent to each other, creating a striking digital wall within the gallery. The large-format screens provide ample space for multiple visitors to engage simultaneously, making the experience ideal for families and groups. Ideum’s team installed the hardware on-site during the week of March 16, carefully positioning and aligning the four large displays within the exhibit space. Precision was key to ensuring a seamless visual presentation across the installation, as well as optimal accessibility for visitors.
The wall on which the displays are mounted features custom graphics from the aquarium, with flowing ocean-inspired visuals and data-driven patterns extending across the wall, providing additional visual context to the custom interactive software on each display.
Following hardware installation, the team prepared the system for the rollout of the custom software experience, which officially launches with the exhibit opening in April. The interactive software will allow visitors to browse topics, explore visualizations, and dive deeper into Mote’s work through intuitive touch interactions designed for a wide range of ages and familiarity levels.
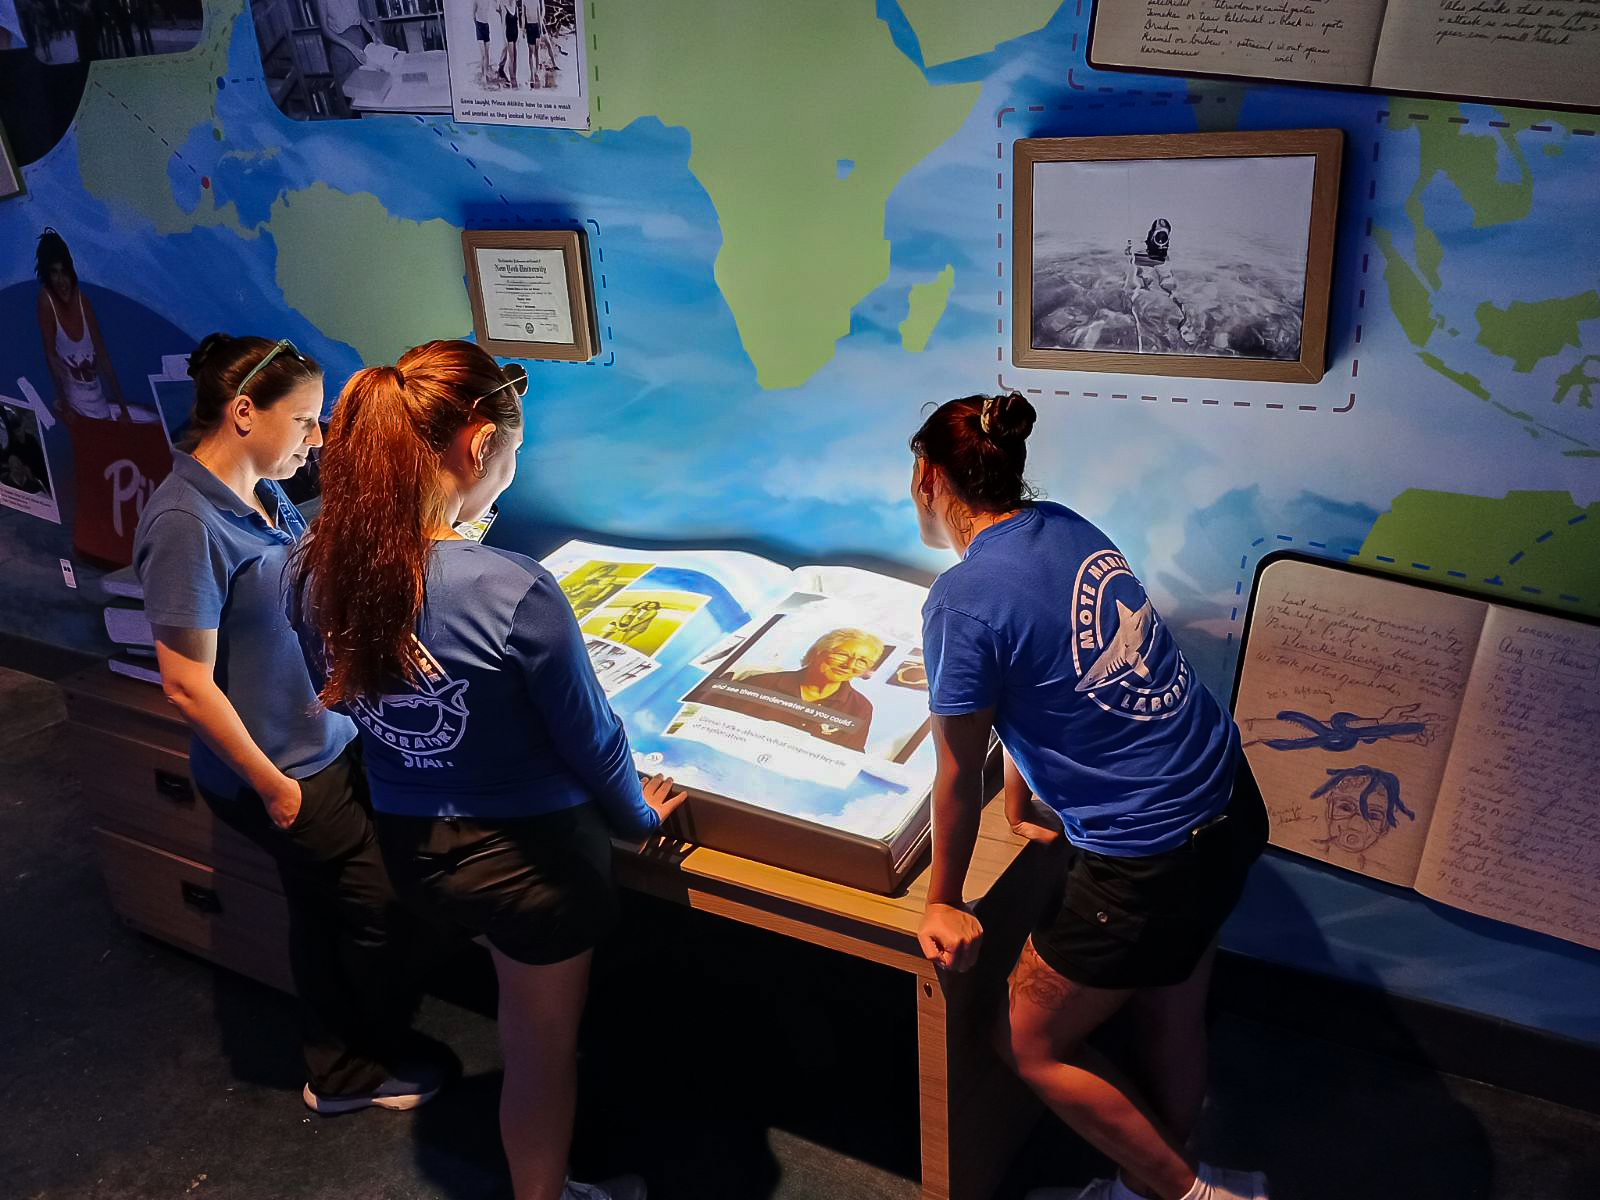
The Data Dashboard builds on Ideum’s ongoing collaboration with Mote, following the successful installation of Eugenie Clark’s Enchanted Book, an interactive exhibit that has quickly become a guest favorite.
Together, these experiences reflect a shared vision: creating engaging, educational environments that inspire curiosity and deepen understanding of marine science.
With the Data Dashboard, Mote SEA visitors are given a unique window into the laboratory’s ongoing work. By combining robust content management tools with engaging interactive design, the exhibit ensures that cutting-edge research is not only visible—but also approachable and meaningful.
As Mote SEA opens its doors, the Data Dashboard stands as a dynamic centerpiece, connecting visitors directly to the science shaping our understanding of the ocean.